Fair Value Gaps explained in plain English
Fair Value Gaps explained in plain English
Fair Value Gaps explained in plain English
Fair value gaps or FVGs are one of the simplest, most useful ways to spot places where price moved too fast and left an imbalance. This post breaks down what they are, why they matter, how to trade them, and how to test them on your own charts.
What is a fair value gap
An FVG is a small empty zone on the chart created when price moves quickly and the wicks of the surrounding candles do not overlap. In practice you see this as a three candle pattern:
- Candle one has a wick
- Candle two moves strongly in one direction creating a large real body
- Candle three closes and its wick does not overlap candle one wick
The empty space between the wick of candle one and the wick of candle three is the gap. That zone shows an area where orders did not match up cleanly and liquidity was swept. Price often comes back to that zone to rebalance before it continues.
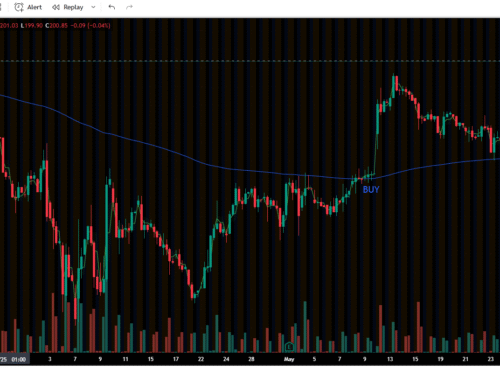
Visual example you can use on any chart
Example with numbers so you can mark this on a live chart:
- Candle 1 high 101 low 99 open 100 close 100.5
- Candle 2 open 100.6 close 106 high 106 low 100.6
- Candle 3 open 105.8 close 105.2 high 105.8 low 105.0
Here the FVG is between candle 1 high 101 and candle 3 low 105.0. Price left a clear empty zone. If price later returns to the zone 101 to 105 that area is an FVG to watch for a potential rebalance.
On your platform draw a box from candle 1 wick to candle 3 wick and keep it visible. That boxed area is the FVG.
Why FVGs matter
Markets are made of orders. A big fast move means market participants did not have time to place offsetting orders at fair prices. The gap represents that imbalance. When price comes back it can:
- Fill the gap and then reverse in the original direction
- Pass through the gap and continue a new move
- Hover and chop inside the gap for a while
ICT style traders treat FVGs as potential entry zones because they often align with liquidity and order flow dynamics. But an FVG by itself is not a trade signal. It is a place to look for confluence with other structure elements.
How traders use FVGs
Simple rules used by many traders
- In an uptrend, look for bullish FVGs below price. If price revisits the zone that can be a long entry area.
- In a downtrend, look for bearish FVGs above price. If price retraces into the zone consider it for a short entry.
- Prefer FVGs on higher timeframes for bigger moves and cleaner zones. Lower timeframe FVGs can be noisy.
- Always check that the FVG lines up with market structure such as previous support or resistance, breaker blocks, or liquidity pools.
Entry setup and trade management
Here is a practical step by step plan you can use:
- Identify trend and market structure on a higher timeframe
- Mark FVGs that line up with that structure
- Wait for price to enter the FVG zone on a lower timeframe and show one of these confirmation signals: a small bullish rejection candle, a wick rejection, or a clear increase in buying volume
- Enter on the first confirmation candle close inside the zone or on a retest of a clean wick rejection
- Place stop loss beyond the nearest structural level or just outside the FVG box depending on your risk comfort
- Scale out into strength. Many traders take partial profits at 50 percent of the expected move and let the rest run with a trailing stop
Example stop placement
- If you go long into a bullish FVG, put your stop a few ticks below the FVG box low or below the previous swing low
- If you short into a bearish FVG, place your stop above the FVG box high or above the previous swing high
Timeframe considerations
FVGs work across timeframes but behave differently:
- Higher timeframe FVGs are more reliable and take longer to fill. They matter for swing and position trades.
- Lower timeframe FVGs are faster but can get filled many times in chop. They are useful for intraday entries but need tighter risk control.
- Match the FVG timeframe to your style. If you are a swing trader prefer daily and four hour zones. If you scalp use five and fifteen minute zones with smaller position size.
Confluence and filters
Never trade an FVG alone. Use other filters to increase the edge:
- Market structure for direction such as higher highs and higher lows or lower highs and lower lows
- Liquidity areas like recent swing highs or lows where stop orders cluster
- Order blocks or breaker blocks that overlap with the FVG
- Volume spikes on the revisit that confirm participation
- Economic events and earnings that can invalidate the setup quickly
Common mistakes and how to avoid them
- Jumping at every gap. If you do that you will lose. Be selective and wait for confluence
- No plan for loss. Always size so a single losing trade does not ruin your account
- Using FVGs on illiquid instruments. Wide spreads and poor fills will kill your edge
- Ignoring timeframe mismatch. If your chart shows daily FVG but you trade it on one minute you will likely get chopped
Backtest plan you can run in a weekend
Do this to see if FVGs fit your style
- Pick a liquid instrument like SPY or a major forex pair
- Choose one timeframe for structure for example daily and one for entries for example fifteen minute
- Scan historical price for FVGs over the last six months and mark them
- Record each revisit: entry price, stop, target, outcome, duration, and notes
- Calculate win rate average reward to risk and expectancy
- Refine rules such as only take FVGs that also overlap a liquidity area or previous swing
This will give you a realistic idea of how often these setups work for your timeframe and instrument.
How to combine FVGs with order flow concepts
FVGs are more powerful when you read them as part of order flow. Think of the gap as a vacuum created by an aggressive sweep. When you see price revisit the zone look for:
- Imbalance removal which appears as slowed momentum into the zone
- Absorption which shows as multiple rejects at the same wick level
- Acceleration away from the zone which signals the original direction is resuming
When order flow tools are not available, use volume and candle structure to approximate these signals.
Quick checklist before you trade an FVG
- Does the FVG align with the higher timeframe bias
- Is the instrument liquid now
- Are there big news events on the calendar
- Can you size the trade to your risk rules
- Do you have an exit plan for profit and loss
Related Posts


Whether you’re just getting started or leveling up your game, Woof Streets is where traders learn, grow, and hunt — together.
We’re a Discord trading community built on trust, transparency, and real results.
We’re a fast-growing community of traders, analysts, and market junkies who know that the best setups don’t bark… they growl. Whether you’re here to learn or to ride the waves with a loyal crew, you’ve found your pack.